Skip to content
Everything you need to understand your data.
Ask questions, build dashboards, monitor metrics, and integrate with your workflow. Open source, self-hostable, $5/user/month hosted.
Ask questions in plain English.
"Show me revenue by region last quarter" — Kyomi finds the right tables across your connected datasources, writes optimized SQL, and generates a chart. No SQL required.
Automatic visualizations
Charts appear alongside your data. Forecast lines with confidence bands, multi-source charts combining data from different databases.
One-click dashboards
Found an insight? Save it to a dashboard instantly. No rebuilding, no exporting.
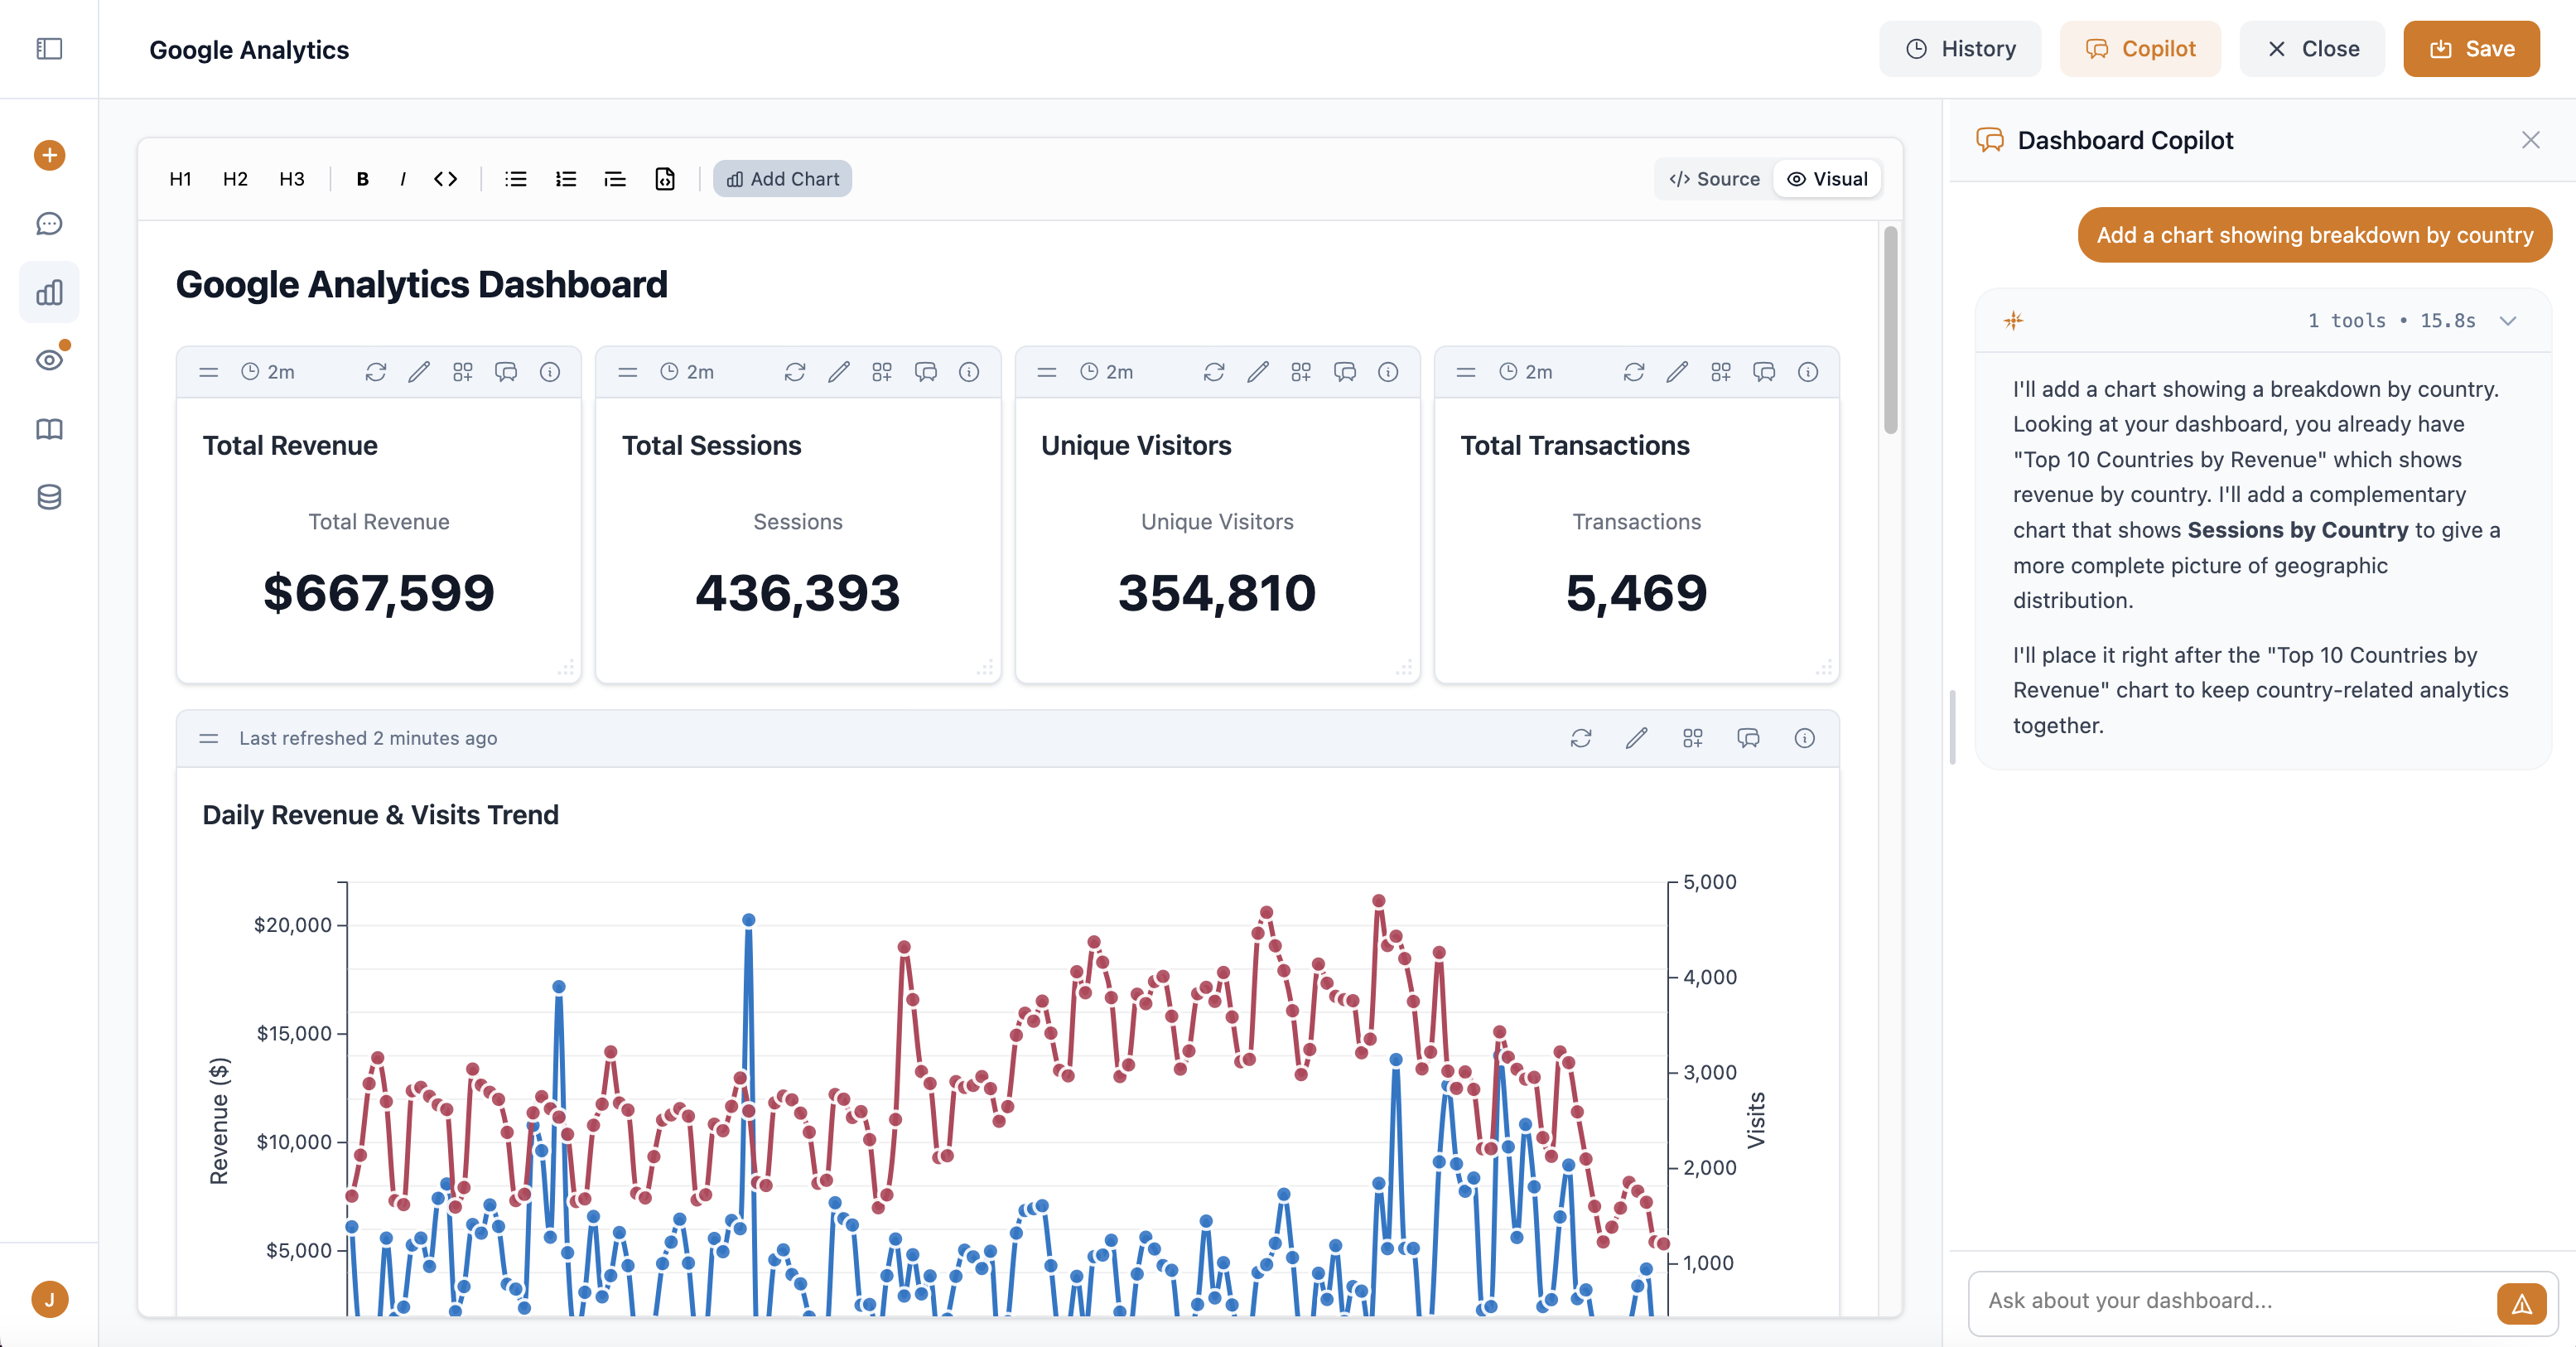
Production dashboards, two ways.
Describe what you want and the AI copilot builds it. Or write ChartML (Markdown + charts) directly for full control. No proprietary formats, no vendor lock-in.
Forecasting
Trends with confidence intervals. No Python notebooks required.
PDF export
Professional PDFs with high-res charts. Ready to email to executives.
Version history
Every save creates a version. Preview, compare, restore.
Multi-source charts
Combine data from different databases in a single chart.
Learns your business. Remembers everything.
Kyomi remembers what "revenue" means in YOUR business. Every conversation makes it smarter. New team members get instant access to years of accumulated data knowledge.
Metric definitions
"MRR excludes trials" — define once, applied consistently everywhere.
Table knowledge
"Customer data is in users, not customers" — saved once, never forgotten.
Business rules
"Exclude @test.com from user counts" — your rules, automatically applied to every query.
Watches your data 24/7.
AI agents monitor your data and alert you when something needs attention. Describe what matters in plain English.
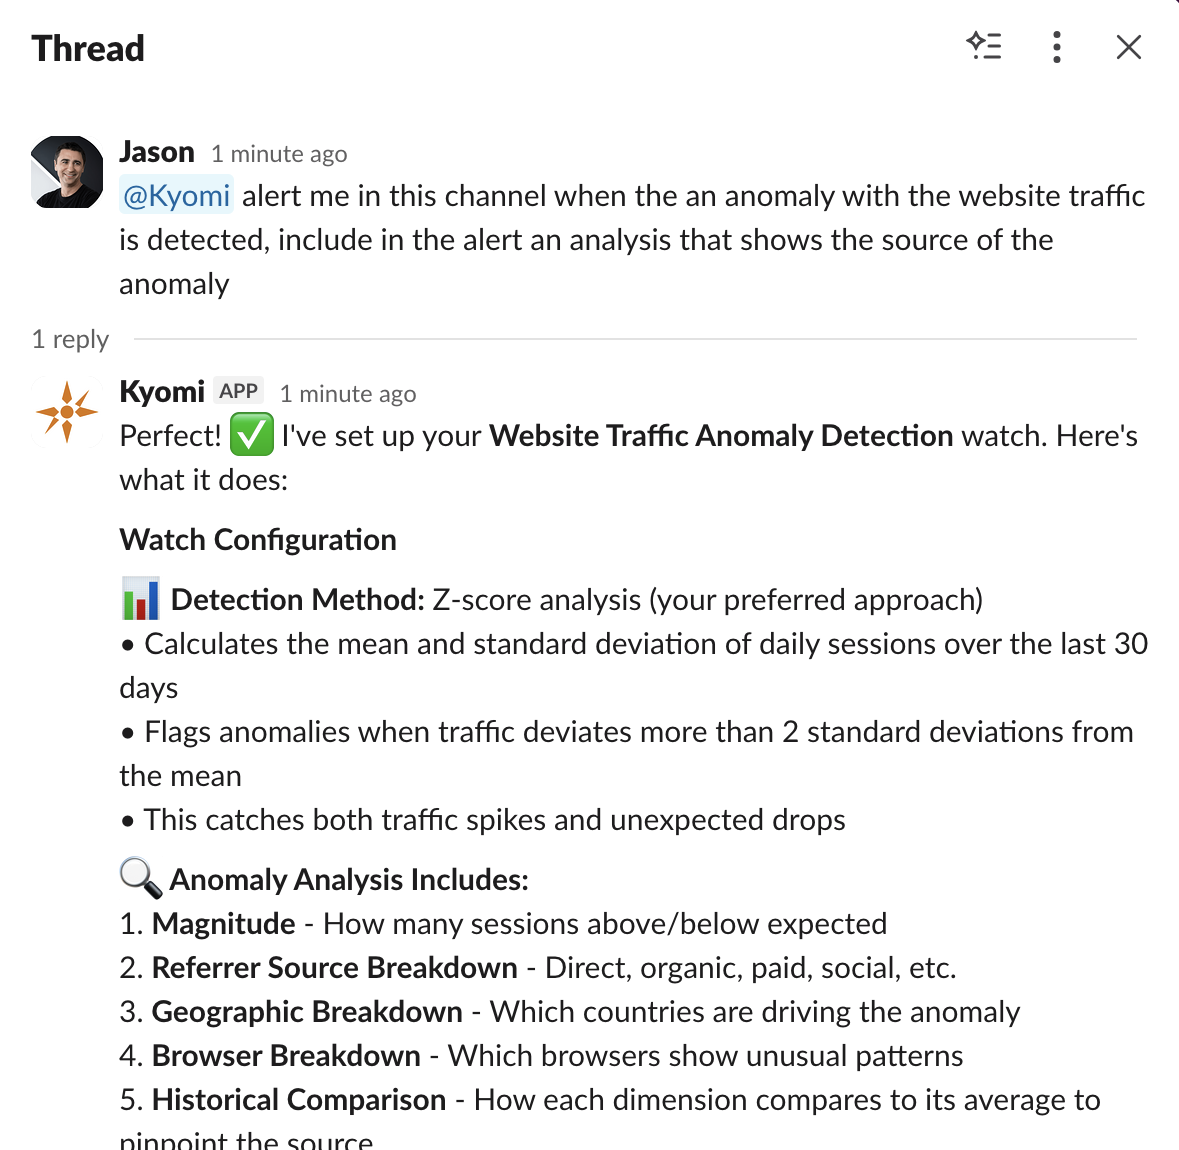
Plain English alerts
"Alert me if revenue drops more than 10%" — describe what matters, Kyomi handles the rest.
Scheduled reports
"Send me a weekly sales summary every Monday" — automatic reports via Slack or email.
Built-in website analytics.
Privacy-focused traffic analytics built into Kyomi. One script tag, no cookies, and the same AI answers questions about your traffic.
Lightweight & private
~1KB script. No cookies, no personal data, no consent banners.
AI-powered traffic insights
"Where is my traffic coming from?" — the same AI that queries your warehouse answers traffic questions.
Included with Cloud
100K events/month included. Overage: $10 per additional 1M events.
Works where you work.
Slack, Claude Code, Cursor — same intelligence, same context, wherever you are.
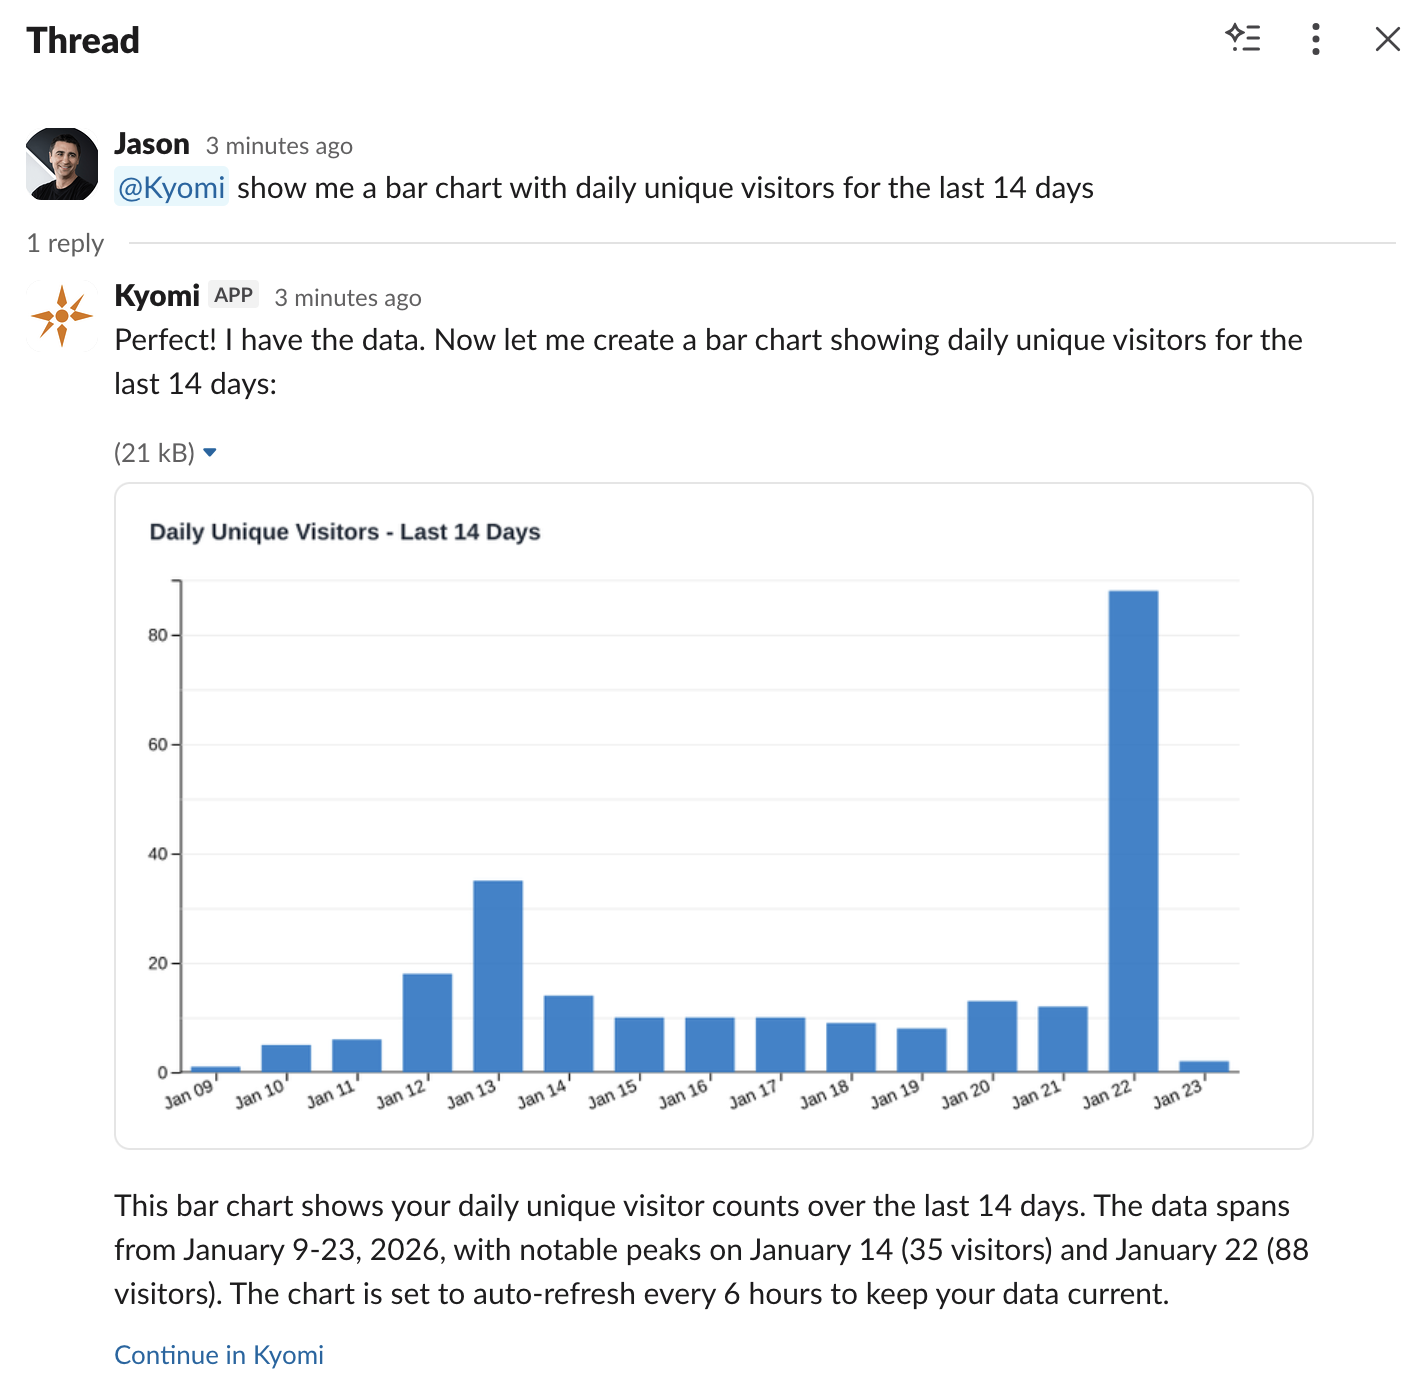
Slack
@kyomi in any channel. Charts render in threads. Conversations sync to the web app.
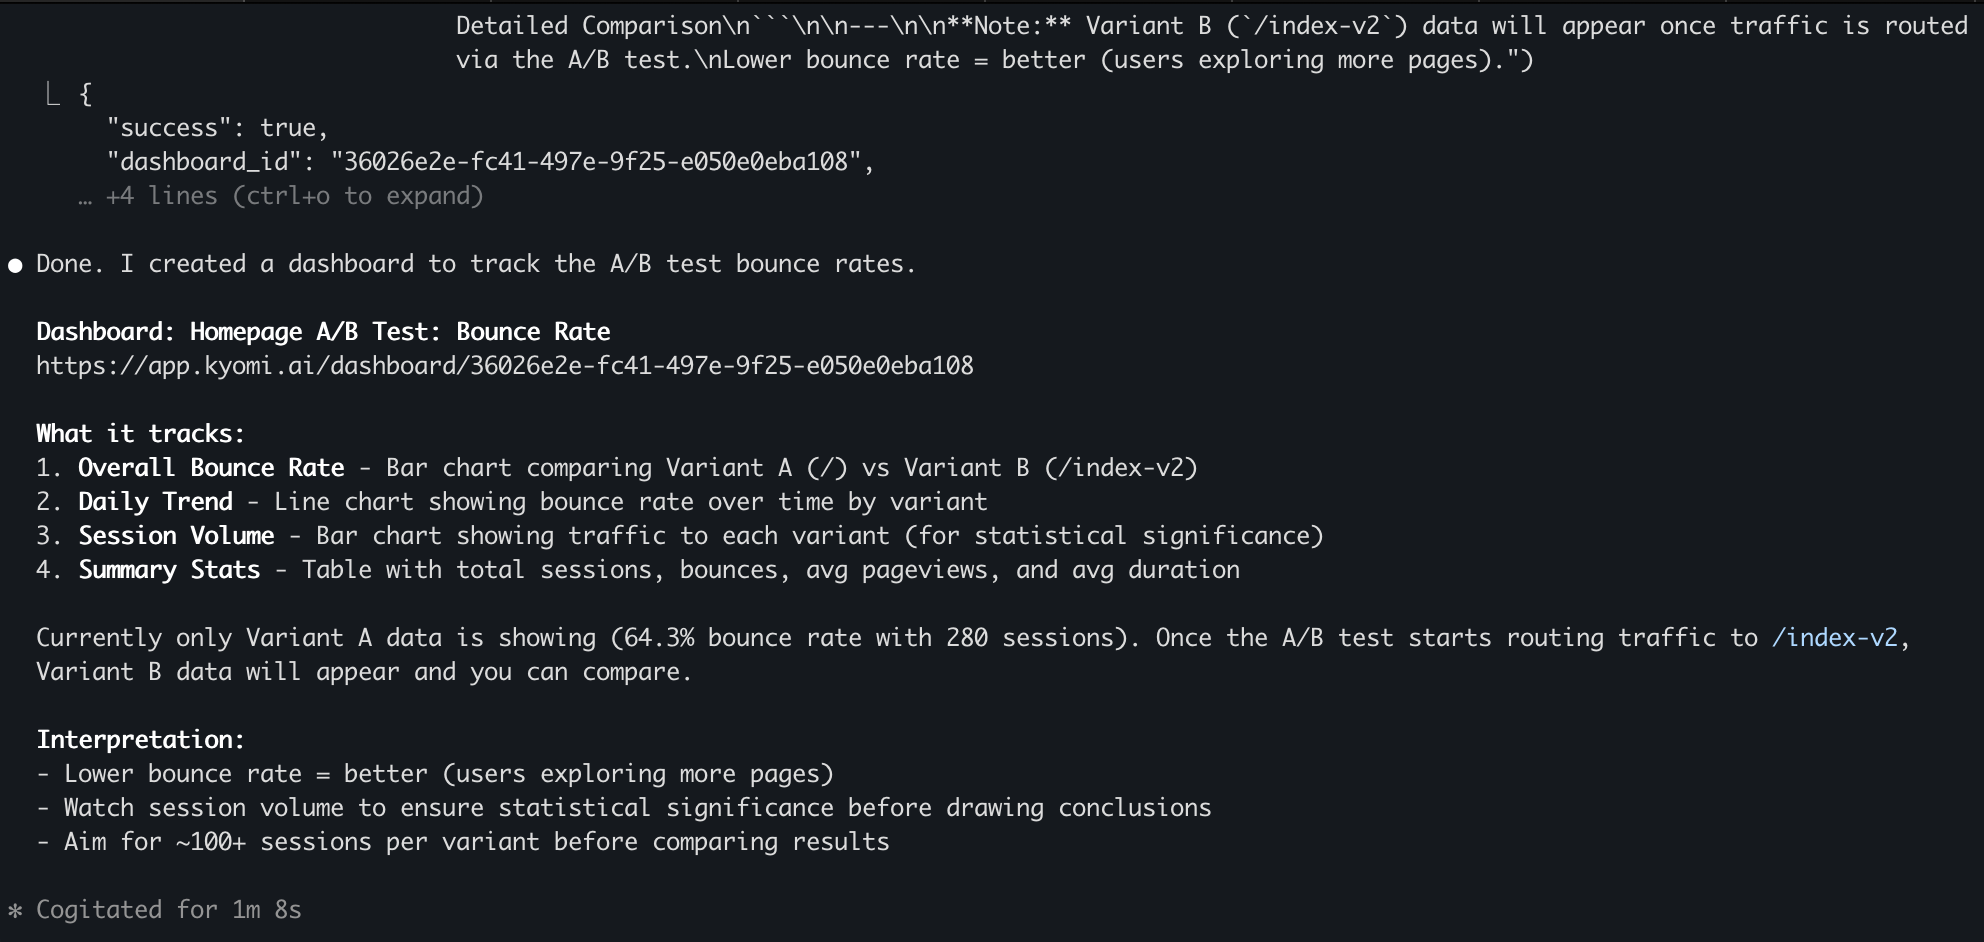
MCP for Claude Code / Cursor
Query your data, search your catalog, build dashboards — without leaving your IDE.
The details.
Queries
- Full query history with search
- Save and star favorite queries
- Cost estimation with scan limits
- SQL editor with autocomplete
Teams
- Multi-user workspaces
- Shared dashboards and knowledge
- Team AI usage pools
Security
- Self-host on your own infrastructure
- Kyomi Connect (open source) for network isolation
- OAuth for cloud platforms
- Encrypted credentials at rest
- Read-only queries, audit logging
9 datasources, same features across all of them.
BigQuery · Snowflake · PostgreSQL · MySQL · ClickHouse · Redshift · Databricks · SQL Server · Azure Synapse
See it in action.
30-day free trial. $5 per user, per month after. No credit card to start.
Start free trial